Each project below represents a real transformation — from confusion to clarity.
🥉 QueryIQ inventory control tower
Starter · Retail & Operations · Inventory control
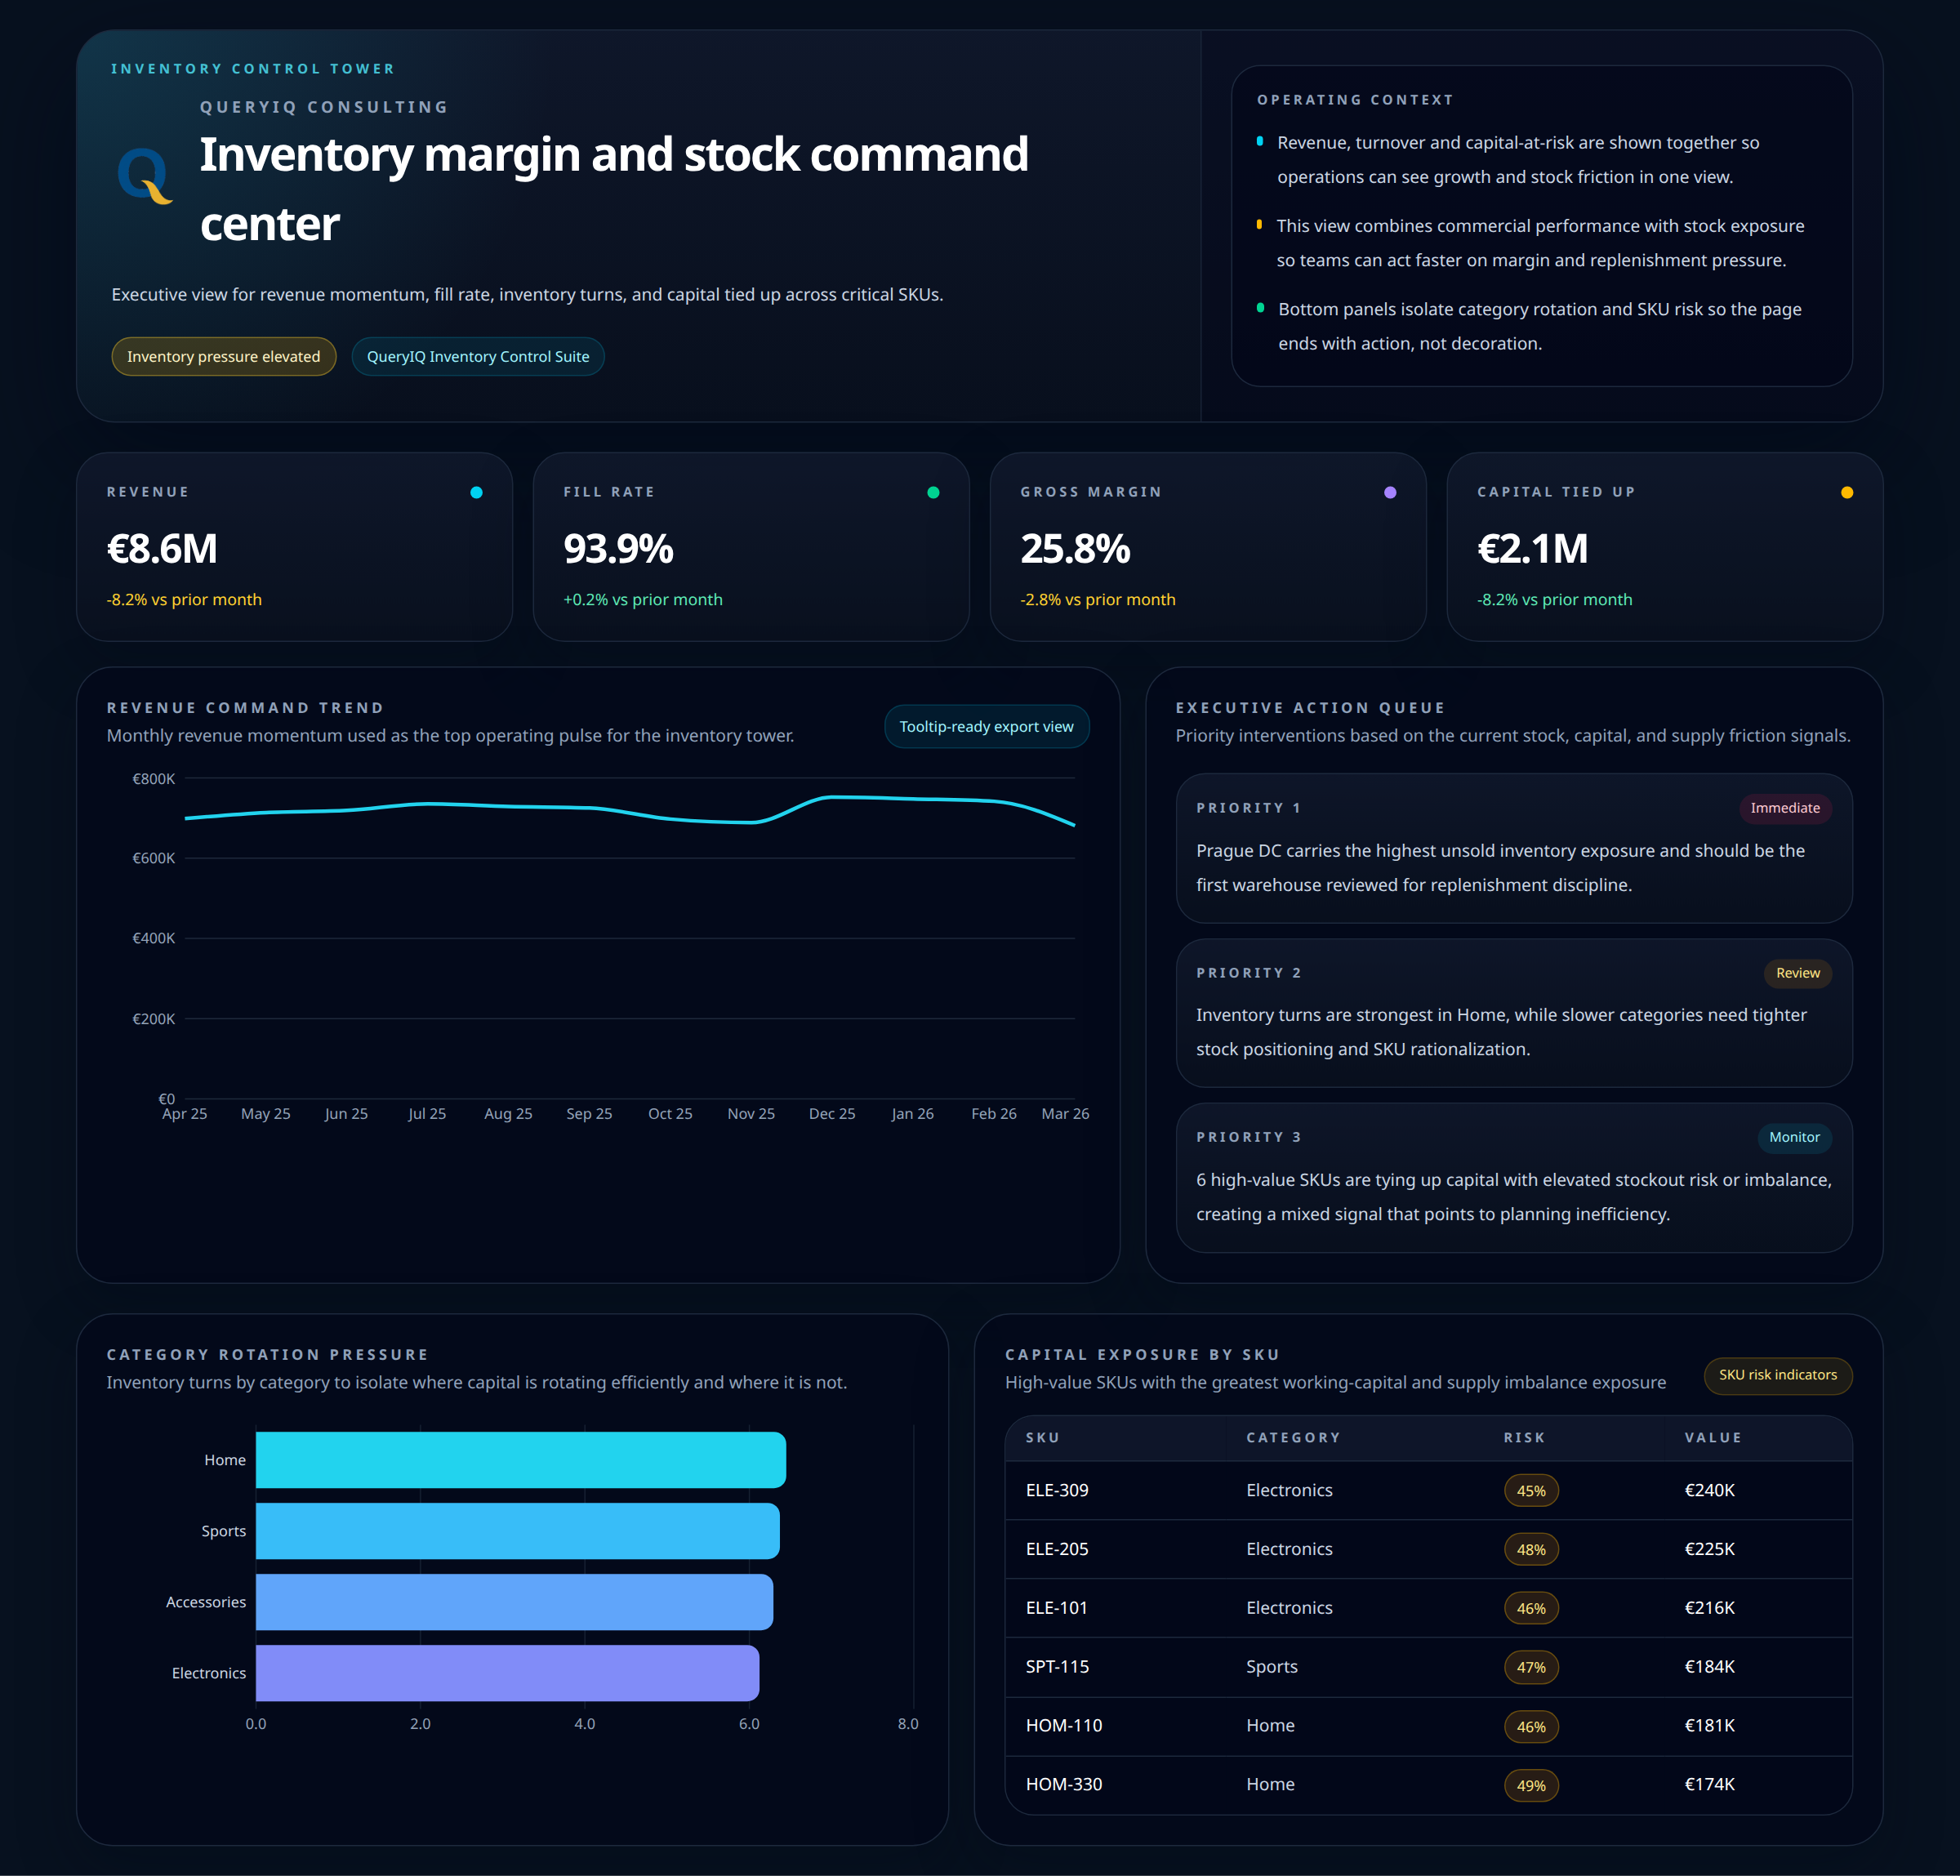
QueryIQ inventory control tower - revenue, fill rate, gross margin, capital tied up, category rotation, and SKU risk in one operating view.
Context
A retail and distribution team could see sales and stock numbers, but not the full commercial picture of where margin and capital were being trapped across critical SKUs.
The Pain
Revenue, fill rate, margin, and working-capital exposure lived in separate reports. By the time teams connected the dots, slow stock and supply friction had already distorted decisions.
The Intervention
QueryIQ built a focused inventory control view around revenue momentum, fill rate, gross margin, capital tied up, category rotation, and SKU-level risk. Commercial, inventory, and warehouse signals were aligned into one operating frame with an action queue for the next interventions.
The Result
Leaders gained one operating view of inventory pressure, margin friction, capital tied up, and priority actions across critical SKUs.
🥈 QueryIQ workforce operations room
Pro · HR & Operations · Workforce intelligence
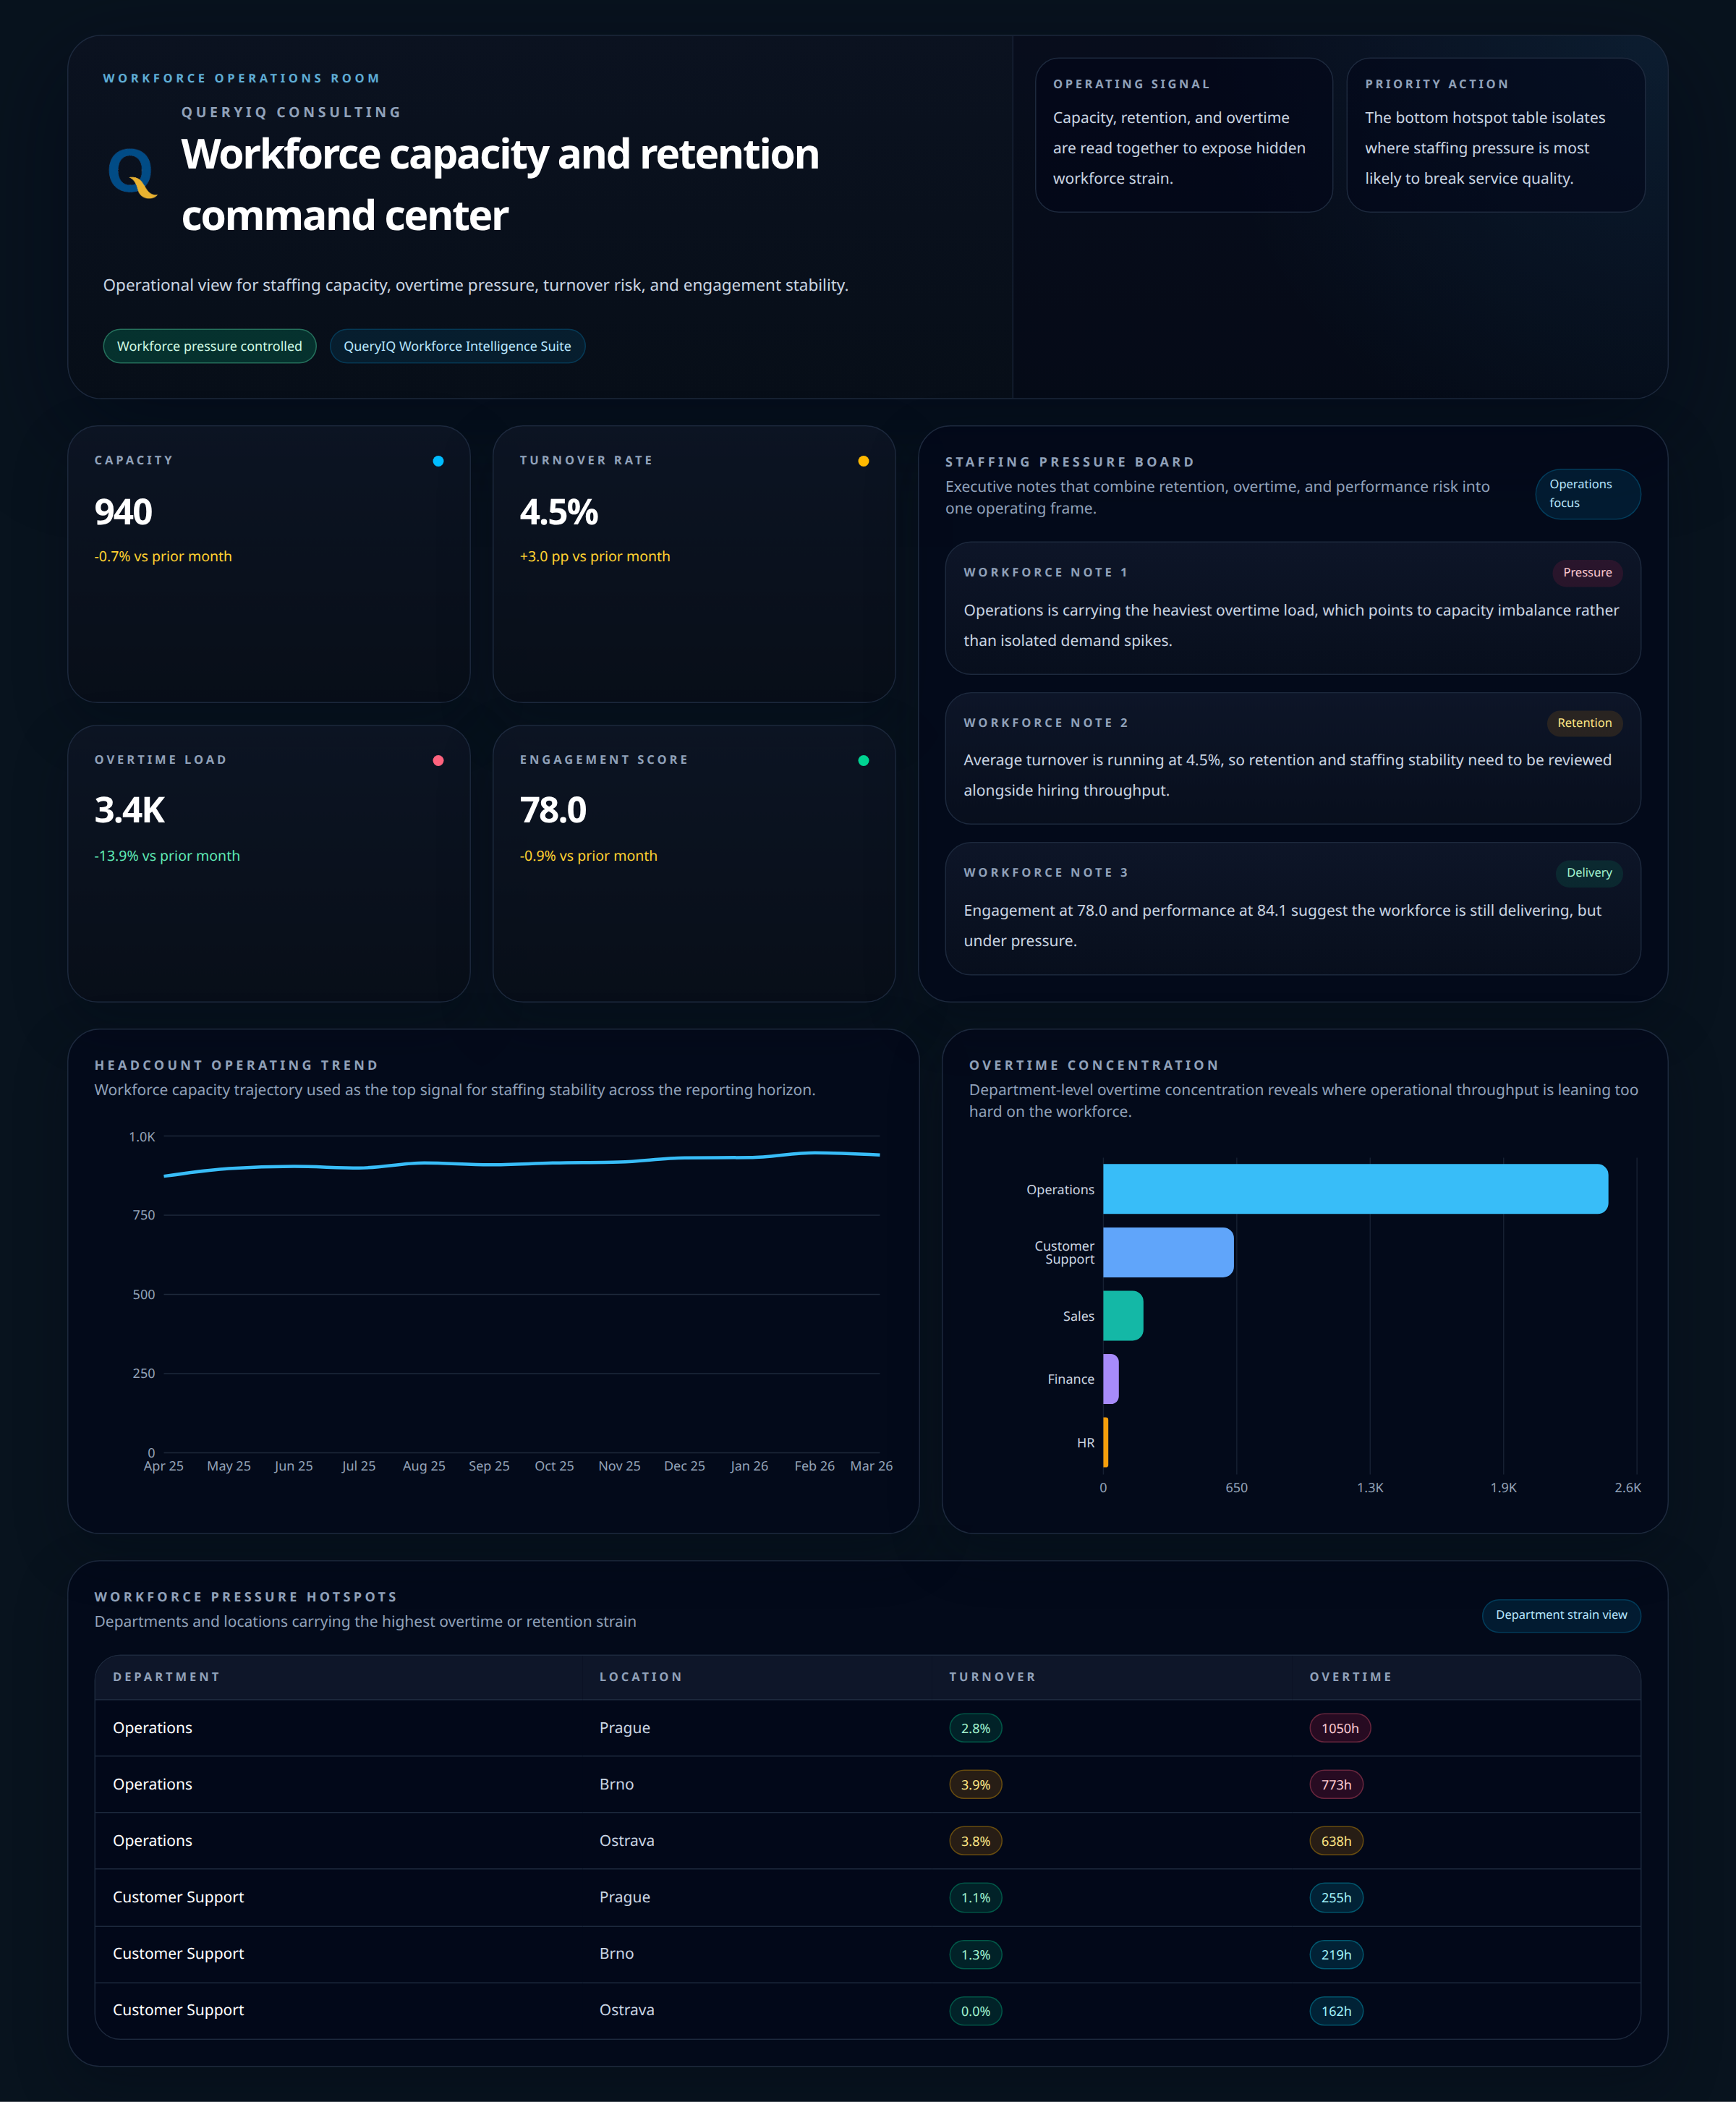
QueryIQ workforce operations room - capacity, turnover risk, overtime load, engagement stability, and workforce hotspots in one operating view.
Context
A multi-site operation had workforce data spread across separate reports, with no shared picture of where staffing strain and retention risk were building first.
The Pain
Capacity, overtime, turnover, and engagement were reviewed in different places. By the time the pressure became visible, service quality and staffing stability were already under strain.
The Intervention
QueryIQ redefined the operating metrics that mattered - capacity, turnover rate, overtime load, engagement stability, and workforce pressure hotspots - then unified the sources into one Power BI model for HR, Operations, and Leadership.
The Result
Leaders gained one trusted view of staffing strain, retention risk, overtime concentration, and location-level pressure across the operation.
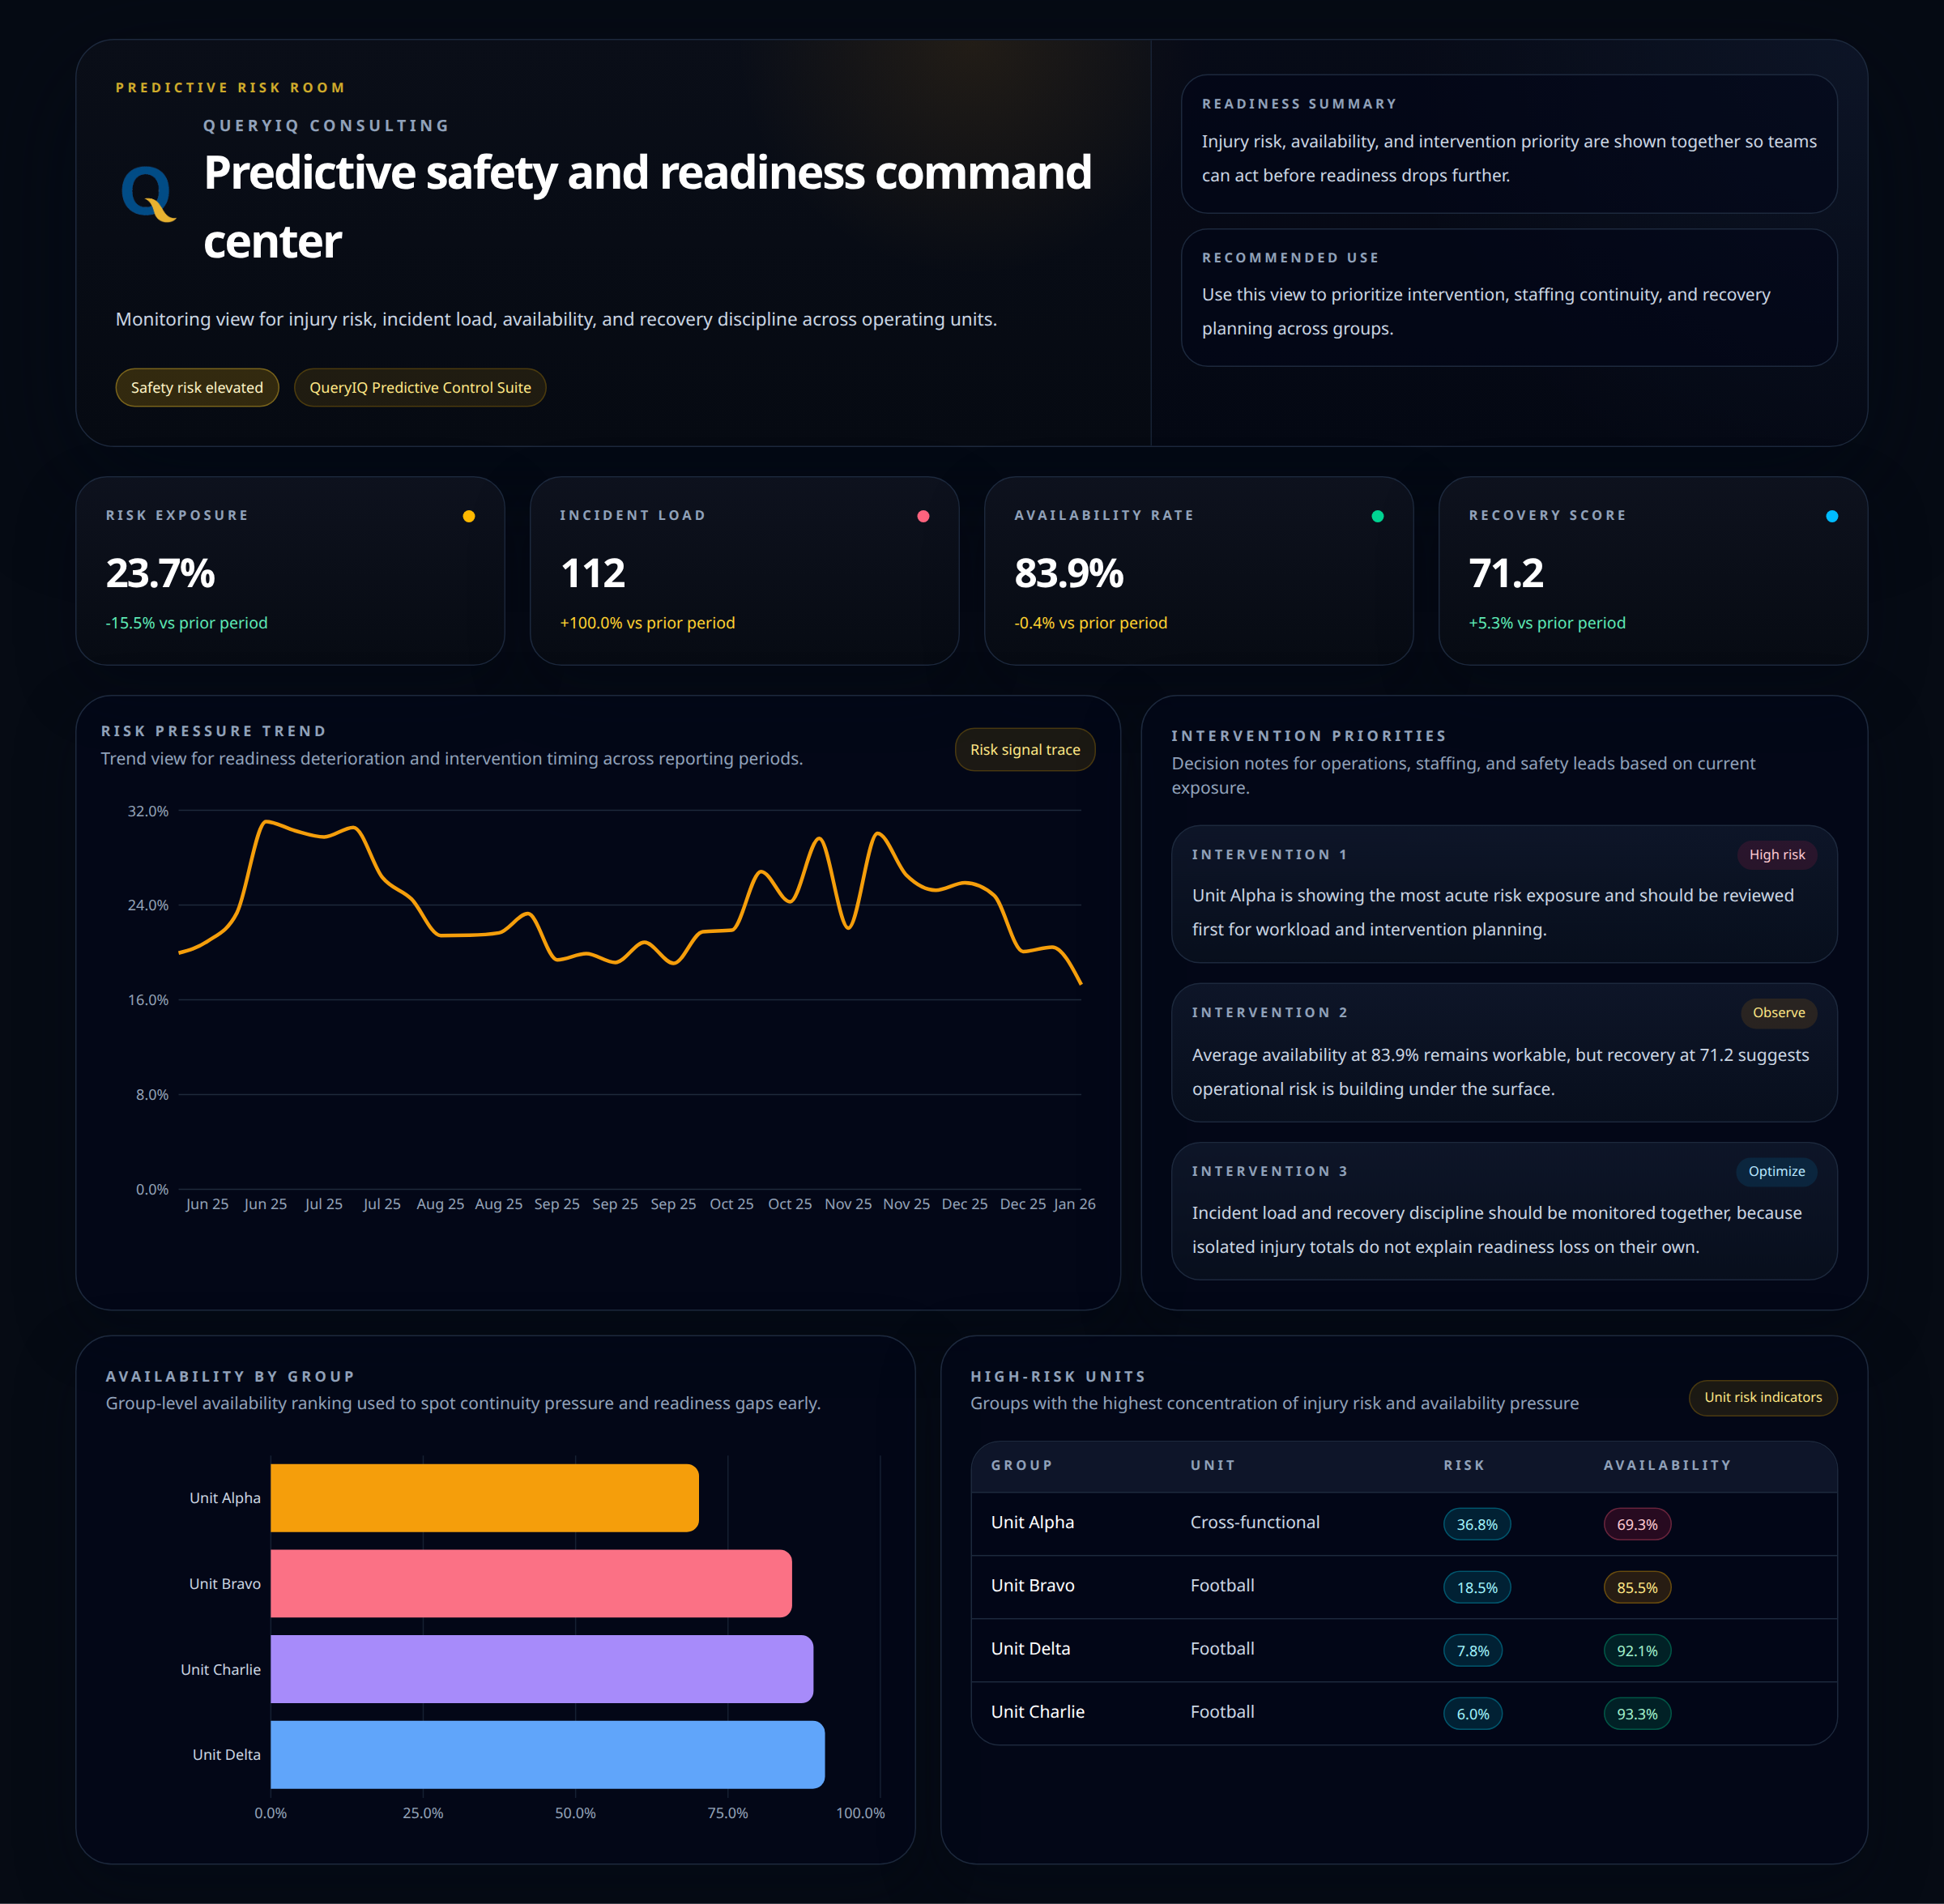
QueryIQ predictive risk room - risk exposure, incident load, availability, recovery score, and intervention priorities in one monitoring view.
Context
A safety-sensitive multi-unit organization could count incidents after they happened, but struggled to see readiness deterioration early enough to intervene.
The Pain
Risk exposure, availability, and recovery signals were reviewed separately. Teams could see incident totals, but they could not see which units were becoming vulnerable before readiness dropped further.
The Intervention
QueryIQ designed a predictive monitoring layer that combined risk exposure, incident load, availability, recovery signals, and intervention priorities into one executive view. High-risk units, group-level availability gaps, and trend deterioration were surfaced early enough for targeted action.
The Result
Leaders gained earlier visibility into readiness deterioration, high-risk units, and intervention timing before availability dropped further.